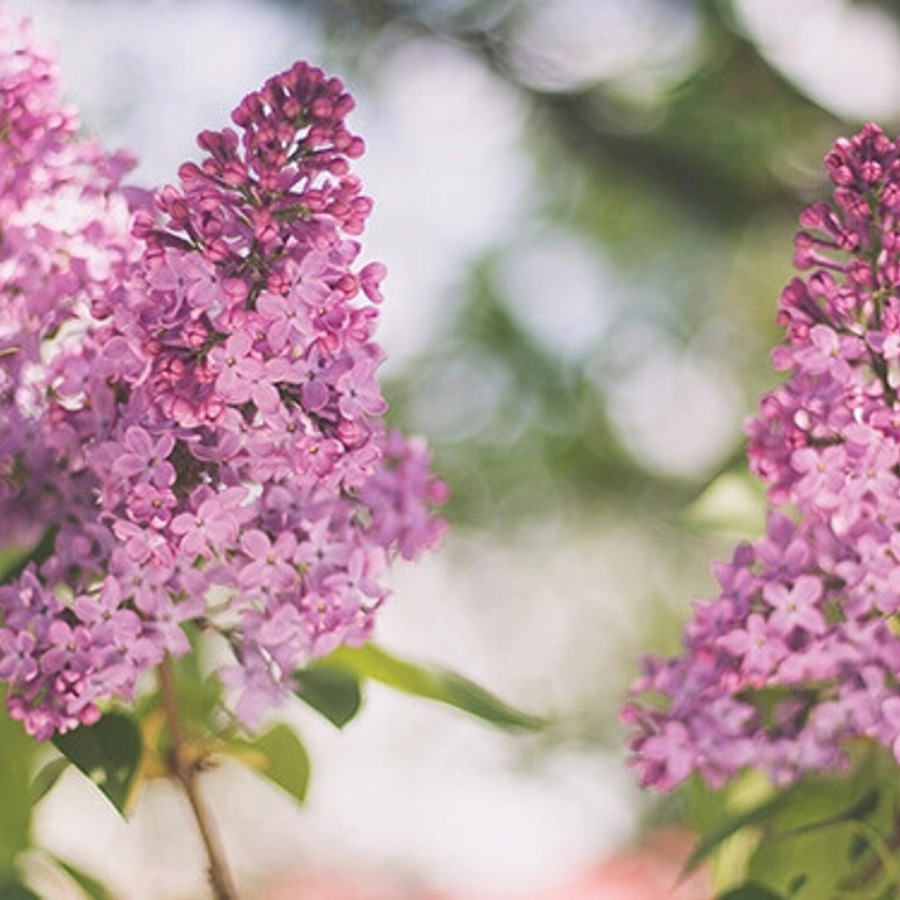
Budburst- Lilac Festival

In this Inquiry, students predict the best date to host a lilac blossom festival so that lilacs are in full bloom in the city where students live. Students are introduced to Project Budburst, a citizen science project in which volunteers monitor the timing of plant life cycle events. Students examine a histogram in FieldScope showing when lilacs are in full flower around the country and discover a large amount of variability. They then discuss factors that affect the timing of plant flowering and decide to look at the relationship between latitude (as a proxy for day length and temperature) and timing of full flower. They examine a scatter plot with a best-fit line in FieldScope. Students identify the latitude of their city and use the best-fit line to calculate a predicted date to host the lilac festival. Finally, they evaluate their level of certainty about the date predicted by the best-fit line and discuss other factors that might contribute to variability in the date of full flower where they live.
Grade Levels: 6-8
Duration: 3 Days
Concepts/Skills: Data and Analysis, Observe patterns in nature, Identify patterns in data
Objectives:
- Analyze data using tools and mathematical models to make claims about when lilacs will be in full bloom in their area.
- Apply concepts of statistics and probability (including determining function fits to data, slope, intercept, and correlation coefficient for linear fits) to predict when lilacs might be in full bloom at a specific latitude.
- Construct a written argument based on data and evidence from Budburst about whether the prediction from a mathematical model should be used to set a date for a lilac festival.
 Skip Navigation

