How do scientists build phylogenetic trees?
June 4, 2019

- Related Topics:
- Evolution,
- Population genetics,
- Bioinformatics,
- Comparing species
A high school student from Egypt asks:
“How do scientists construct phylogenetic trees and know the degree of relatedness between living organisms by DNA?
Do they just look for similarities between the whole genomes? Or just specific genes? Or RNA? Or what exactly?”
A phylogenetic tree is a diagram used to show how organisms are related to one another.
There are actually a lot of different ways to make these trees! As long as you have something you can compare across different species, you can make a phylogenetic tree.
A phylogenetic tree can be built using physical information like body shape, bone structure, or behavior. Or it can be built from molecular information, like genetic sequences.
In general, the more information you’re able to compare, the more accurate the tree will be. So you’d get a more accurate tree by comparing entire skeletons, instead of just a single bone. Or by comparing entire genomes, instead of just a single gene.
Any DNA, RNA, or protein sequence can be used to generate a phylogenetic tree. But DNA sequences are most commonly used in generating trees today.


What’s in a phylogenetic tree?
In a phylogenetic tree, each line is called a branch. The end of each branch is called a tip – this is where you put a species!
Each point where the two branches split is called a node. A node is the most recent common ancestor of all species on those branches.
And if you go all the way down to the bottom of the tree, the last node is called the root. This is the common ancestor of all the species in the tree!


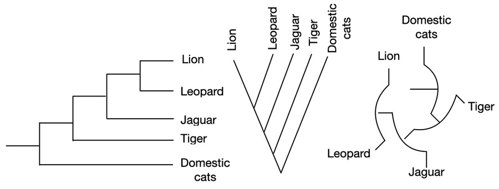
You can draw phylogenetic trees in many different shapes. It doesn’t matter whether it’s rectangular or circular. The import part is how it is branched. The branching represents the differences in the relationship of species.
These trees all show exactly the same information! Just in different shapes.


How to construct a phylogenetic tree?
Any DNA, RNA, or protein sequences can be used to draw a phylogenetic tree. But DNA sequences are the most widely used. It’s pretty cheap and easy now to get DNA sequences. Plus DNA contains more information, which can make more accurate trees. For example, some changes in DNA sequences do not lead to changes in proteins.
To construct a tree, we’ll compare the DNA sequences of different species.
Evolutionarily related species have a common ancestor. Before they split into separate species, they had exactly the same DNA. But as species evolve and diverge, they will accumulate changes in the DNA sequences.
We can use these changes in the DNA to tell how closely related two species are. If there aren’t very many differences, they’re probably closely related. If there are a lot of changes, they might be more distant relatives.
The first thing to do is align the two DNA sequences together that you’re going to compare. Make sure you’re comparing the same gene! (Or other sequence.) Otherwise you are comparing apples to oranges.
This sequence alignment is often done with the help of computer programs. The strategy is to find the alignment that has the most matches and the least mismatches.
You can align and compare as many sequences as you want. Remember, the more information you consider, the more accurate your tree will be!


Convert sequence alignment to a relatedness
Ok, so you’ve got your DNA aligned. Now what? How do you convert that into a tree?
Next you compare the sequences, to see how similar they are to each other.
We can see that Sequence #1 vs #2 have one difference. Sequence #2 vs #3 have 2 differences. Sequences #3 vs #4 has 5 differences. And so on.
Just by looking at them, we can see that Sequences 1 and 2 are pretty similar. We would group them together in a tree.


But we can do better than just looking at them. You can actually calculate how similar any two sequences are, and make a table to compare all the differences. This especially helps when you’re comparing a lot of information!
Sequences 1 and 2 differ by 1 nucleotide, out of the 20 total. So the difference between Sequence 1 and 2 is:
1/20= 0.05
We can calculate the difference between each pair of sequences. If we put the calculated differences in a matrix, it would look like this:


Now if you look at the matrix, the pairs that have the lowest values are the most similar. As before, we can see that sequences 1 and 2 are very similar. So we can put 1 and 2 together.


After we put 1 and 2 together, we will have to recalculate the difference between sequences. Now that we’ve 1-2 together in the tree, we’re going to consider them as a single group. We’ll calculate the differences with other sequences by taking an average.
For example, the difference between 1&2 vs 3 would be:
Average of (1 vs 3) and (2 vs 3) = 1-2 vs 3
½ * (0.1+0.1)= 0.1
Similarly, we could calculate the differences with other sequences. We would have a table like below:


Looking at the table, we can see 3 is most similar with 1-2. So we can group 3 together with 1-2.


Now, we will repeat the above steps. We will treat 1, 2, and 3 as one species as we keep building the tree. We’ll use the average of 1-2 vs other and 3 vs other to do this.
For example, the difference between 1-3 and 4 would be:
Average of (1-2 vs 4) and (3 vs 4) = 1-2-3 vs 4
½ * (0.2+0.25) = 0.225
We can calculate the rest with the same method. Now we have a table as below:


We can see that 1-3 and 4 are most similar. So we can put 4 and 1-3 together.


Now we can add in sequence 5 and get our tree!


You can use this method to build all sorts of trees! Not all trees will look like this one, but the same basic principles will apply.
Read More:
- Khan Academy: Building a phylogenetic tree
- UC Berkeley: Reconstructing trees from physical characteristics
- HHMI: Creating phylogenetic trees from DNA sequences
- Interested in knowing how related any two species are? Check out: http://www.timetree.org/ Or if you give it a list of species, it will build a tree for you!

Author: Dr. Allison Zhang
When this answer was published in 2019, Allison was a post-doctoral fellow in the Department of Genetics, studying the Exposome (how environmental exposures affect your health) in Mike Snyder’s laboratory. She wrote this answer while participating in the Stanford at The Tech program.
 Skip Navigation
